

RNA-seq analysis has become a staple of modern bioinformatics. It’s reliable, foundational, and applicable across a wide range of biological questions. But if RNA-seq is the bread and butter of transcriptomics, then RNA modification sequencing is sourdough with herbed olive oil–a familiar base, but infused with richer, more complex insights into gene regulation.
What are RNA Modifications?
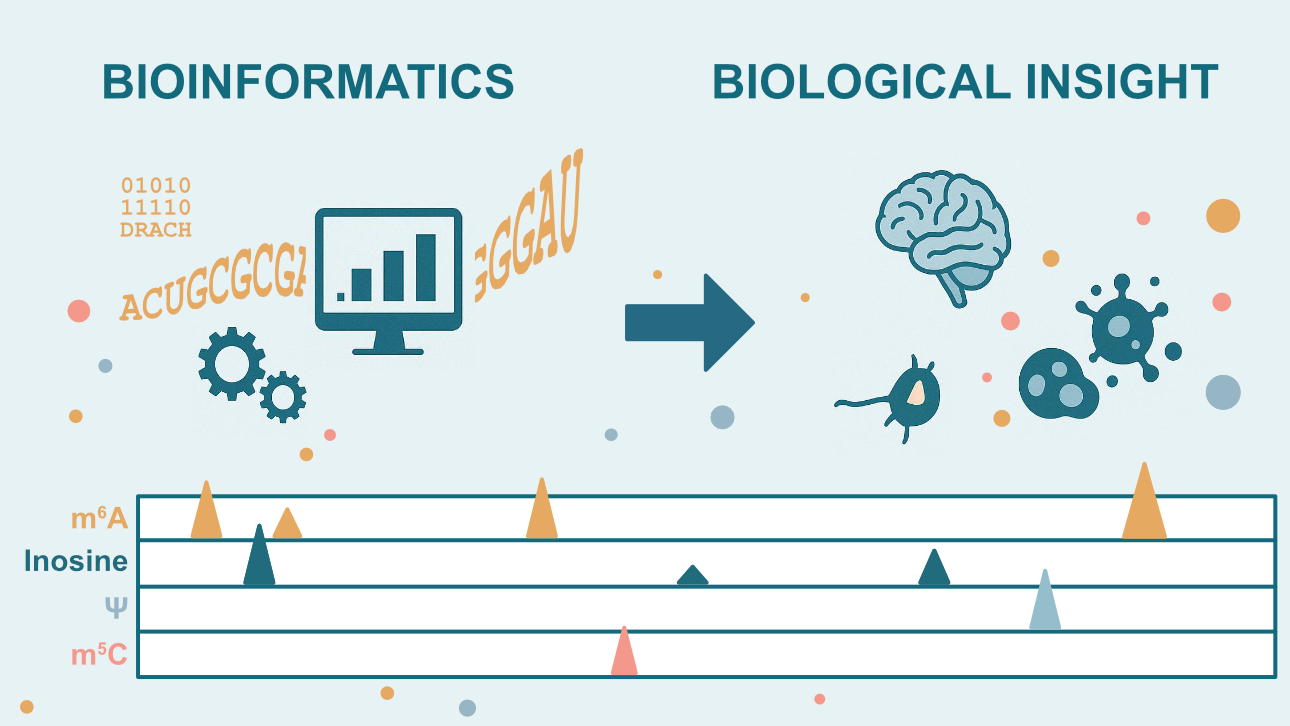
RNA molecules are not just passive messengers of genetic code. They are dynamically regulated through a diverse array of chemical modifications, like N6-methyladenosine (m⁶A), inosine, pseudouridine (Ψ), and more. Each transcript can carry several of these marks, which influence how RNA is spliced, exported, translated, or degraded1.
Despite being pervasive, some RNA modifications are dynamically regulated–written, read, and erased in a short window between transcription and translation. Studying them has been challenging, but recent advances have revealed their critical roles in development, cancer, neurodegeneration, immunity, and metabolic disease2-4.
Why RNA Modification Data Require Specialized Analysis
Although analysis of RNA modification assays borrow elements from RNA-seq and CHIP-seq workflows, they bring unique bioinformatic requirements:
- Tools must support non-uniform, modification-specific coverage influenced by expression, strand, and transcript region
- Metrics integrating modification-specific features to support accurate calls (e.g., DRACH motifs for m⁶A, A-to-I editing events for inosine)
- Dedicated algorithms to detect RNA modifications through either peak calling or signal-based models
- Learning models trained to separate signal from noise, particularly in transcripts with low abundance modifications
| Transcriptomics | Epigenomics | Epitranscriptomics (RNA Modifications) | ||||
|---|---|---|---|---|---|---|
| Assay | RNA-seq | CHIP-seq | GLORI | Nanopore dRNA-seq | MeRIP-seq | EpiPlex™ |
| Targeted Molecules | RNA fragments | Enriched DNA fragments bound by protein | RNA fragments modified at m6A | RNA | Enriched RNA fragments with m6A | Enriched RNA fragments with RNA modifications |
| Enrichment-based Assay | ❌ | ✅ | ❌ | ❌ | ✅ | ✅ |
| Typical Total RNA Input | 100 ng – 1 μg | 1 – 50 ng (DNA) | 20 – 100 ng | 500 ng – 2 μg | 100 ng – 1 μg | 50 – 250 ng |
| Example Pipeline | nf-core/rna-seq | nf-core/chipseq | GLORI-tools | Dorado | MeRIPseqPipe | EpiScout™ |
| FastQ QC | ✅ | ✅ | ✅ | ✅ | ✅ | ✅ |
| Adapter and Read Trimming | ✅ | ✅ | ⚠️* | ✅ | ✅ | ✅ |
| Splice-Aware Alignment | ✅ | N/A | ✅ | ✅ | ✅ | ✅ |
| PCR De-duplication | ✅ | ✅ | ⚠️* | N/A | ✅ | ✅ |
| Peak Calling | ❌ | ✅ | N/A | N/A | ✅ | ✅ |
| Variant Calling | ❌ | N/A | ✅ | ✅ | ❌ | ✅ |
| Normalization to Baseline Expression | N/A | N/A | N/A | N/A | ✅ | ✅ |
| Differential Expression Analysis | ⚠️* | N/A | ⚠️* | ⚠️* | ✅ | ✅ |
| RNA Modification Spike-in Control Support | ❌ | N/A | ❌ | ❌ | ⚠️* | ✅ |
| Differential RNA Modification Analysis | N/A | ✅ | ✅ | ⚠️* | ✅ | ✅ |
| Multiple RNA Modification Support | N/A | ✅ | ❌ | ✅ | ❌ | ✅ |
| RNA Modification Resolution | N/A | N/A | ✅ Single base | ✅ Single base | ⚠️ Peak level | ✅ Single base Inosine ⚠️ Peak level m6A |
* Common but not natively performed within example pipeline
Key Bioinformatics Challenges in RNA Modification Analysis
1. Sparse Signal and Low Abundance
Many RNA modifications–such as 5-methylcytidine (m⁵C)–are rare or conditionally expressed. Others, like inosine, are more abundant but often localized to intronic regions that are typically under-covered in typical RNA modification workflows. This makes robust spike-in controls and accurate normalization essential to distinguish low modification sites from background noise. Controls and spike-ins are not optional; they’re foundational.
2. RNA-Specific Peak Calling
Classic peak callers (like MACS2 or HOMER) were built for DNA-centric assays and assume depth uniformity, lack of strand specificity, and constant background noise 5-7. These assumptions break down with RNA data. Tools like exomePeak2, HEPeak, m6Aboost and m6ACali offer RNA-focused solutions but often focus solely on m⁶A and depend on training datasets which are very model-specific, limiting their broader use8-12.
3. Differentially Expressed Genes Modified Regions
Identifying differentially modified regions is not the same as detecting differentially expressed genes. RNA modifications often cluster at 3’ UTRs or introns rather than spanning the entire gene. These features require statistical models with region-level resolution and careful control for baseline gene expression that diverge from the capabilities of DESeq2 or edgeR, which are designed for gene-level count data13-14.
4. Multi-Modification Detection
Most tools are modification-specific, and most are developed for m⁶A. Yet real biological samples often carry multiple modifications, sometimes on the same transcript. To capture this complexity, you need assays and pipelines that can handle more than one modification at a time.
Right now, only EpiPlex™ and Oxford Nanopore’s direct RNA sequencing generate signals for multiple RNA modifications15. But detecting them isn’t straightforward. It takes two things:
- Physical controls with known modifications to match signal patterns
- Smart models—like machine learning tools—to tell similar signals apart
Most current pipelines still focus on one modification at a time, and robust multi-modification detection across platforms is still developing.
5. Reproducibility and Tool Maintenance
Many academic tools become obsolete after publication, making it difficult to reproduce results or apply them to new datasets. Sustained, version-controlled, and documented pipelines–like nf-core and GATK–show how community-driven development and commercial support can ensure long-term usability and broad adoption.
The need for more sophisticated, reproducible tools has also been recognized at the national level. In 2024, the National Academies released a full-length report calling for stronger informatics infrastructure to support RNA modification research16. Shared infrastructure is key to supporting growth in the RNA modification space.
Best Practices for Accurate RNA Modification Analysis
Here’s what we recommend at Alida Biosciences:
Normalize for Gene Expression
If a gene isn’t expressed, it can’t be modified. Highly expressed genes can yield false positives due to sheer abundance. Always normalize enrichment signals against baseline expression.
Use Internal Controls
Include synthetic RNA spike-ins carrying known levels of modification. These act as anchors for scaling your data and evaluating technical variation (see our blog “Epitruth or Epifiction? How to know if RNA Modification Data Can Be Trusted“]
Visualize Your Modification Calls
Load your BAM and BedGraph files into IGV or UCSC Genome Browser to confirm modification calls visually. This is especially important before investing in downstream experiments.
Use Modification-Specific Biological Context
Confirm m⁶A peaks with DRACH motif overlap, or identify inosine A-to-I editing using A-to-G mismatches. These patterns strengthen biological plausibility.
From Data to Discovery: Biological Insight from RNA Modifications
Once you’ve mapped RNA modifications, what can you actually learn?
1. Gene and Transcript-Level Insights
RNA modifications like m⁶A don’t just decorate transcripts–they drive essential cell functions and play a critical role in disease biology.
Take Huntington’s disease: Pupak et al. (2024) found that m⁶A marks in intron 1 of mutant HTT RNA trigger the production of a toxic splice variant (HTT1a)–a transcript that escapes normal processing and fuels neurodegeneration17. When researchers erased those marks, the pathogenic RNA dropped–without touching full-length HTT.
Modification patterns can reveal condition-specific regulation of transcripts, especially when a gene is known to be involved in a phenotype or process.
Pro tip: Modifications often cluster near cryptic splice sites, stop codons, or 3′ UTRs–prime real estate to regulate gene expression.
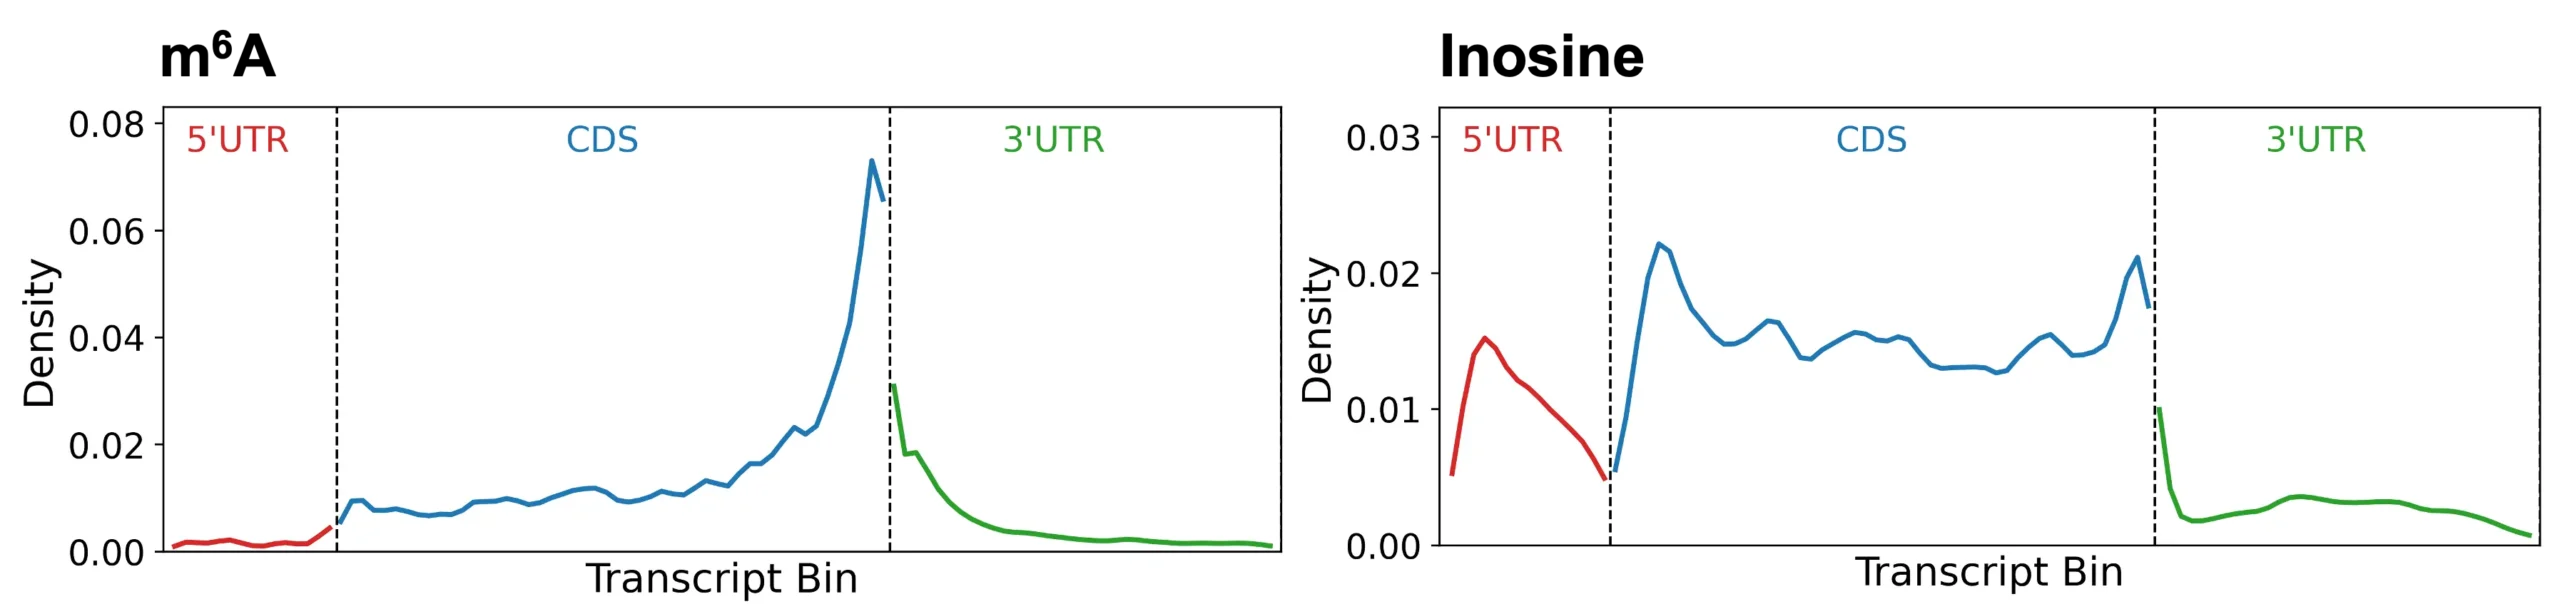
Figure 1: Distribution of m6A and inosine across a hypothetical transcript binned into 100 parts. m6A (left) is abundant at the coding domain (CDS)/3’UTR junction. Inosine (right) has a diffuse distribution across introns (included in the CDS), 5’UTR, and 3’UTR.
2. Pathway-Level Insights
Once you’ve identified your modified transcripts, don’t stop at the gene-level, ask what they’re doing.
Try running GSEA or GO enrichment on your modified transcript list. You might find:
- Immune signaling: Inosine editing protects endogenous dsRNA from being treated as a viral RNA, often dampening innate immunity pathways18.
- Neuroplasticity: In neurons, m⁶A and A-to-I edits cluster in genes tied to synaptic signaling and calcium transport–fine-tuning circuit dynamics without changing expression19.
- Cancer control: Modifications like m⁶A and inosine editing hit transcripts in cell cycle, stress response, and apoptosis pathways, helping tumors rewire post-transcriptional control20.
Try it: Compare pathway enrichment from modification-enriched versus differentially expressed transcripts–you may uncover completely different biology.
3. Zoom Out: Epitranscriptome-Wide Patterns
Sometimes the biggest insights come from stepping back.
Global modification patterns–like overall inosine or m⁶A levels–can shift dramatically across conditions, reflecting the activity (or inactivity) of writers and readers. For instance, cancers often show elevated m⁶A, while some tumors dial down ADAR editing to evade immune detection21.
Use overall modification patterns as input for data dimensionality reduction tools: PCA (Principal Component Analysis) or UMAP (Uniform Manifold Approximation and Projection), and you may see samples naturally cluster by disease state, cell type, or even molecular subtype–purely from their modification “fingerprints”.
In a recent study, Santos et al. (2024) showed that global A-to-I editing profiles could distinguish living versus post-mortem brain tissue using PCA–revealing that RNA editing patterns persist as robust markers of tissue viability22.
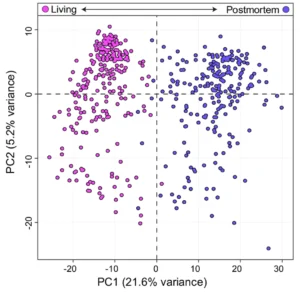
Figure 2: Principal component analysis (PCA) of inosine of living (left) vs post-mortem (right) brain tissue adapted from Santos et al. 2024 under a Creative Commons Attribution 4.0 International License. PCA reveals distinct RNA editing patterns correlated with tissue viability. Changes were made to the original figure.
4. Integration with Other Omics
RNA modifications can fill in the blanks between transcript levels and protein output.
We all know gene expression doesn’t always predict protein abundance. That’s where modifications come in–they influence mRNA stability, translation, and decay, offering critical insight into why a transcript is (or isn’t) making protein.
You can also treat modification features as input for machine learning models. Adding modification data to expression or splicing features can improve subtype prediction, especially in cancer or treatment response studies.
AlidaBio’s EpiScout™ Analysis Suite
To address many of these challenges, AlidaBio built the EpiScout analysis pipeline, the informatics engine behind the EpiPlex RNA Modification Detection Kits.
What EpiScout Analysis Suite Does:
- Normalizes pileup data to baseline gene expression
- Controls for technical variation using known-modification spike-ins
- Uses a custom Hidden Markov Model-based peak caller
- Detects multiple modifications in parallel (e.g. m⁶A, inosine)
- Identifies statistically significant differentially modified regions (DMRs) using a modification-centric statistical model
- Outputs rich, reproducible reports:
- QC metrics
- Peak tables and metagene plots
- DRACH enrichment and A→G mutation analysis
- Differential peak comparisons
Easy to Access and Use:
The EpiScout pipeline is available on DNAnexus and as a Docker image, making it easy to deploy across a variety of computing environments. It is maintained with version control and technical documentation to support transparent, scalable research.
Conclusion
RNA modifications are a critical but under explored layer of post-transcriptional regulation. As the field matures, so too must the tools that support it. Whether you’re working on neurodevelopment, cancer biology, or building disease classifiers, integrating RNA modification analysis into your workflow unlocks a deeper, more nuanced view of gene regulation.
To explore how EpiPlex™ Assays and EpiScout™ Analysis Suite can empower your research, visit our Resource Hub.
Explore additional posts in our Mods in Motion series
Blog posts
What Are Those RNA Modifications Doing for Gene Regulation?
The hidden language of RNA – how epigenetics is shaping medicine
Visit our Media Hub
About the Author
Dana Nachmanson
Dana Nachmanson is a Senior Bioinformatics Scientist at Alida Biosciences, where she supports customers in analyzing and interpreting RNA modification data. She earned her Ph.D. in Bioinformatics and Systems Biology from UC San Diego, where she focused on sequencing method optimization for early cancer detection. With a background in error-corrected sequencing and translational genomics, particularly within biotech startup environments, Dana is passionate about connecting cutting-edge technologies with researchers to drive advancements in science.
References
- Roundtree, I. A., et al. (2017). Dynamic RNA modifications in gene expression regulation. Cell, 169(7), 1187–1200. https://doi.org/10.1016/j.cell.2017.05.045
- Batista, P., Molinie, B., Wang, J., Qu, K., Zhang, J., Li, L., Chang, H. Y. (2014). m^6A RNA modification controls cell fate transition in mammalian embryonic stem cells. Cell Stem Cell, 15(6), 707–719. https://doi.org/10.1016/j.stem.2014.09.019
- Ji, R., & Zhang, X. (2021). The roles of m^6A in regulating stem cell fate. Frontiers in Cell and Developmental Biology, 9, 765635. https://doi.org/10.3389/fcell.2021.765635
- Jonkhout, N., et al. (2017). The RNA modification landscape in human disease. RNA, 23(12), 1754–1769. https://doi.org/10.1261/rna.063503.117
- Zhang, Y., Liu, T., Meyer, C. A., Eeckhoute, J., Johnson, D. S., Bernstein, B. E., … Liu, X. S. (2008). Model-based analysis of ChIP-Seq (MACS). Genome Biology, 9, R137.
- Zang, C., Schones, D. E., Zeng, C., Cui, K., Zhao, K., & Peng, W. (2009). A clustering approach for identification of enriched domains from histone modification ChIP-Seq data. Bioinformatics, 25(15), 1952–1958. https://doi.org/10.1093/bioinformatics/btp340
- http://homer.ucsd.edu/homer/ngs/peaks.html
- Meng, J., Cui, X., Rao, M. K., Chen, Y., & Huang, Y. (2013). Exome‑based analysis for RNA epigenome sequencing data. Bioinformatics, 29(12), 1565–1567. https://doi.org/10.1093/bioinformatics/btt171
- Cui, X., Meng, J., Rao, M. K., Chen, Y., & Huang, Y. (2015). HEPeak: an HMM‑based exome peak‑finding package for RNA epigenome sequencing data. BMC Genomics, 16, 201.
- Körtel, N., Rücklé, C., Zhou, Y., Busch, A., Hoch‑Kraft, P., Sutandy, F. X. R., Haase, J., Pradhan, M., Musheev, M., Ostareck, D., Ostareck‑Lederer, A., Dieterich, C., Hüttelmaier, S., Niehrs, C., Rausch, O., Dominissini, D., König, J., & Zarnack, K. (2021). Deep and accurate detection of m^6A RNA modifications using miCLIP2 and m^6Aboost machine learning. Nucleic Acids Research, 49(16), e92. https://doi.org/10.1093/nar/gkab485
- Cui, X., Meng, J., Zhang, S., Chen, Y., & Huang, Y. (2016). A novel algorithm for calling mRNA m^6A peaks by modeling biological variances in MeRIP‑seq data. Bioinformatics, 32(12), i378–i385. https://doi.org/10.1093/bioinformatics/btw281
- Ye, H., Li, T., Rigden, D. J., & Wei, Z. (2024). m6ACali: machine learning‑powered calibration for accurate m^6A detection in MeRIP‑Seq. Nucleic Acids Research, 52(9), 4830–4842. https://doi.org/10.1093/nar/gkae280
- Love, M. I., Huber, W., & Anders, S. (2014). Moderated estimation of fold change and dispersion for RNA‑seq data with DESeq2. Genome Biology, 15, 550. https://doi.org/10.1186/s13059-014-0550-8
- Robinson, M. D., McCarthy, D. J., & Smyth, G. K. (2010). edgeR: a Bioconductor package for differential expression analysis of digital gene expression data. Bioinformatics, 26(1), 139–140. https://doi.org/10.1093/bioinformatics/btp616
- https://www.nature.com/articles/s41467-024-48437-4 Wu et al. (May 2024): “Transfer learning enables identification of multiple types of RNA modifications using nanopore direct RNA sequencing”
- National Academies of Sciences, Engineering, and Medicine. (2024). Current and Emerging Tools and Technologies for Studying RNA Modifications. In Charting a Future for Sequencing RNA and Its Modifications: A New Era for Biology and Medicine. Washington, DC: The National Academies Press. https://doi.org/10.17226/27165
- Pupak, A., Rodríguez‑Navarro, I., Sathasivam, K., et al. (2024). m⁶A modification of mutant huntingtin RNA promotes the biogenesis of pathogenic huntingtin transcripts. EMBO Reports, 25(11), 5026–5052. https://doi.org/10.1038/s44319-024-00283-7
- Yuan, J., Xu, L., Bao, H.-J., Wang, J.-L., Zhao, Y., & Chen, S. (2023). Biological roles of A‑to‑I editing: implications in innate immunity, cell death, and cancer immunotherapy. Journal of Experimental & Clinical Cancer Research, 42, 149. https://doi.org/10.1186/s13046-023-02727-9
- Rosenthal, J. J. C., & Seeburg, P. H. (2012). A‑to‑I RNA editing: effects on proteins key to neural excitability. Neuron, 74(3), 432–439. https://doi.org/10.1016/j.neuron.2012.03.011
- Li, Y. et al. (2023). RNA modifications in cancer. Molecular Cancer, 2025 review. https://doi.org/10.1002/mco2.70042
- Wang, F., Wang, Y., Yuan, Y., Zhou, D., Liu, X., Zhang, X.,… Li, X. (2024). Malignant A‑to‑I RNA editing by ADAR1 drives immune evasion in tumors. Cell Reports, 43(1), 110202. https://doi.org/10.1016/j.celrep.2024.110202
- Rodriguez de los Santos, M., Kopell, B. H., Grice, A. B., & Charney, A. W. (2024). Divergent landscapes of A‑to‑I editing in postmortem and living human brain. Nature Communications, 15, 5366. https://doi.org/10.1038/s41467-024-49268-z