


EpiPlex™ Platform for m6A, Inosine, and Pseudouridine Detection with RNA Expression
Detect, locate, and quantify multiple RNA modifications plus RNA expression in one simple experiment.
EpiPlex™ Services
Turnkey RNA modification profiling. Send samples and receive data—Uni-Mod, Duo-Mod, or Tri-Mod—with the same EpiScout™ analysis and support.
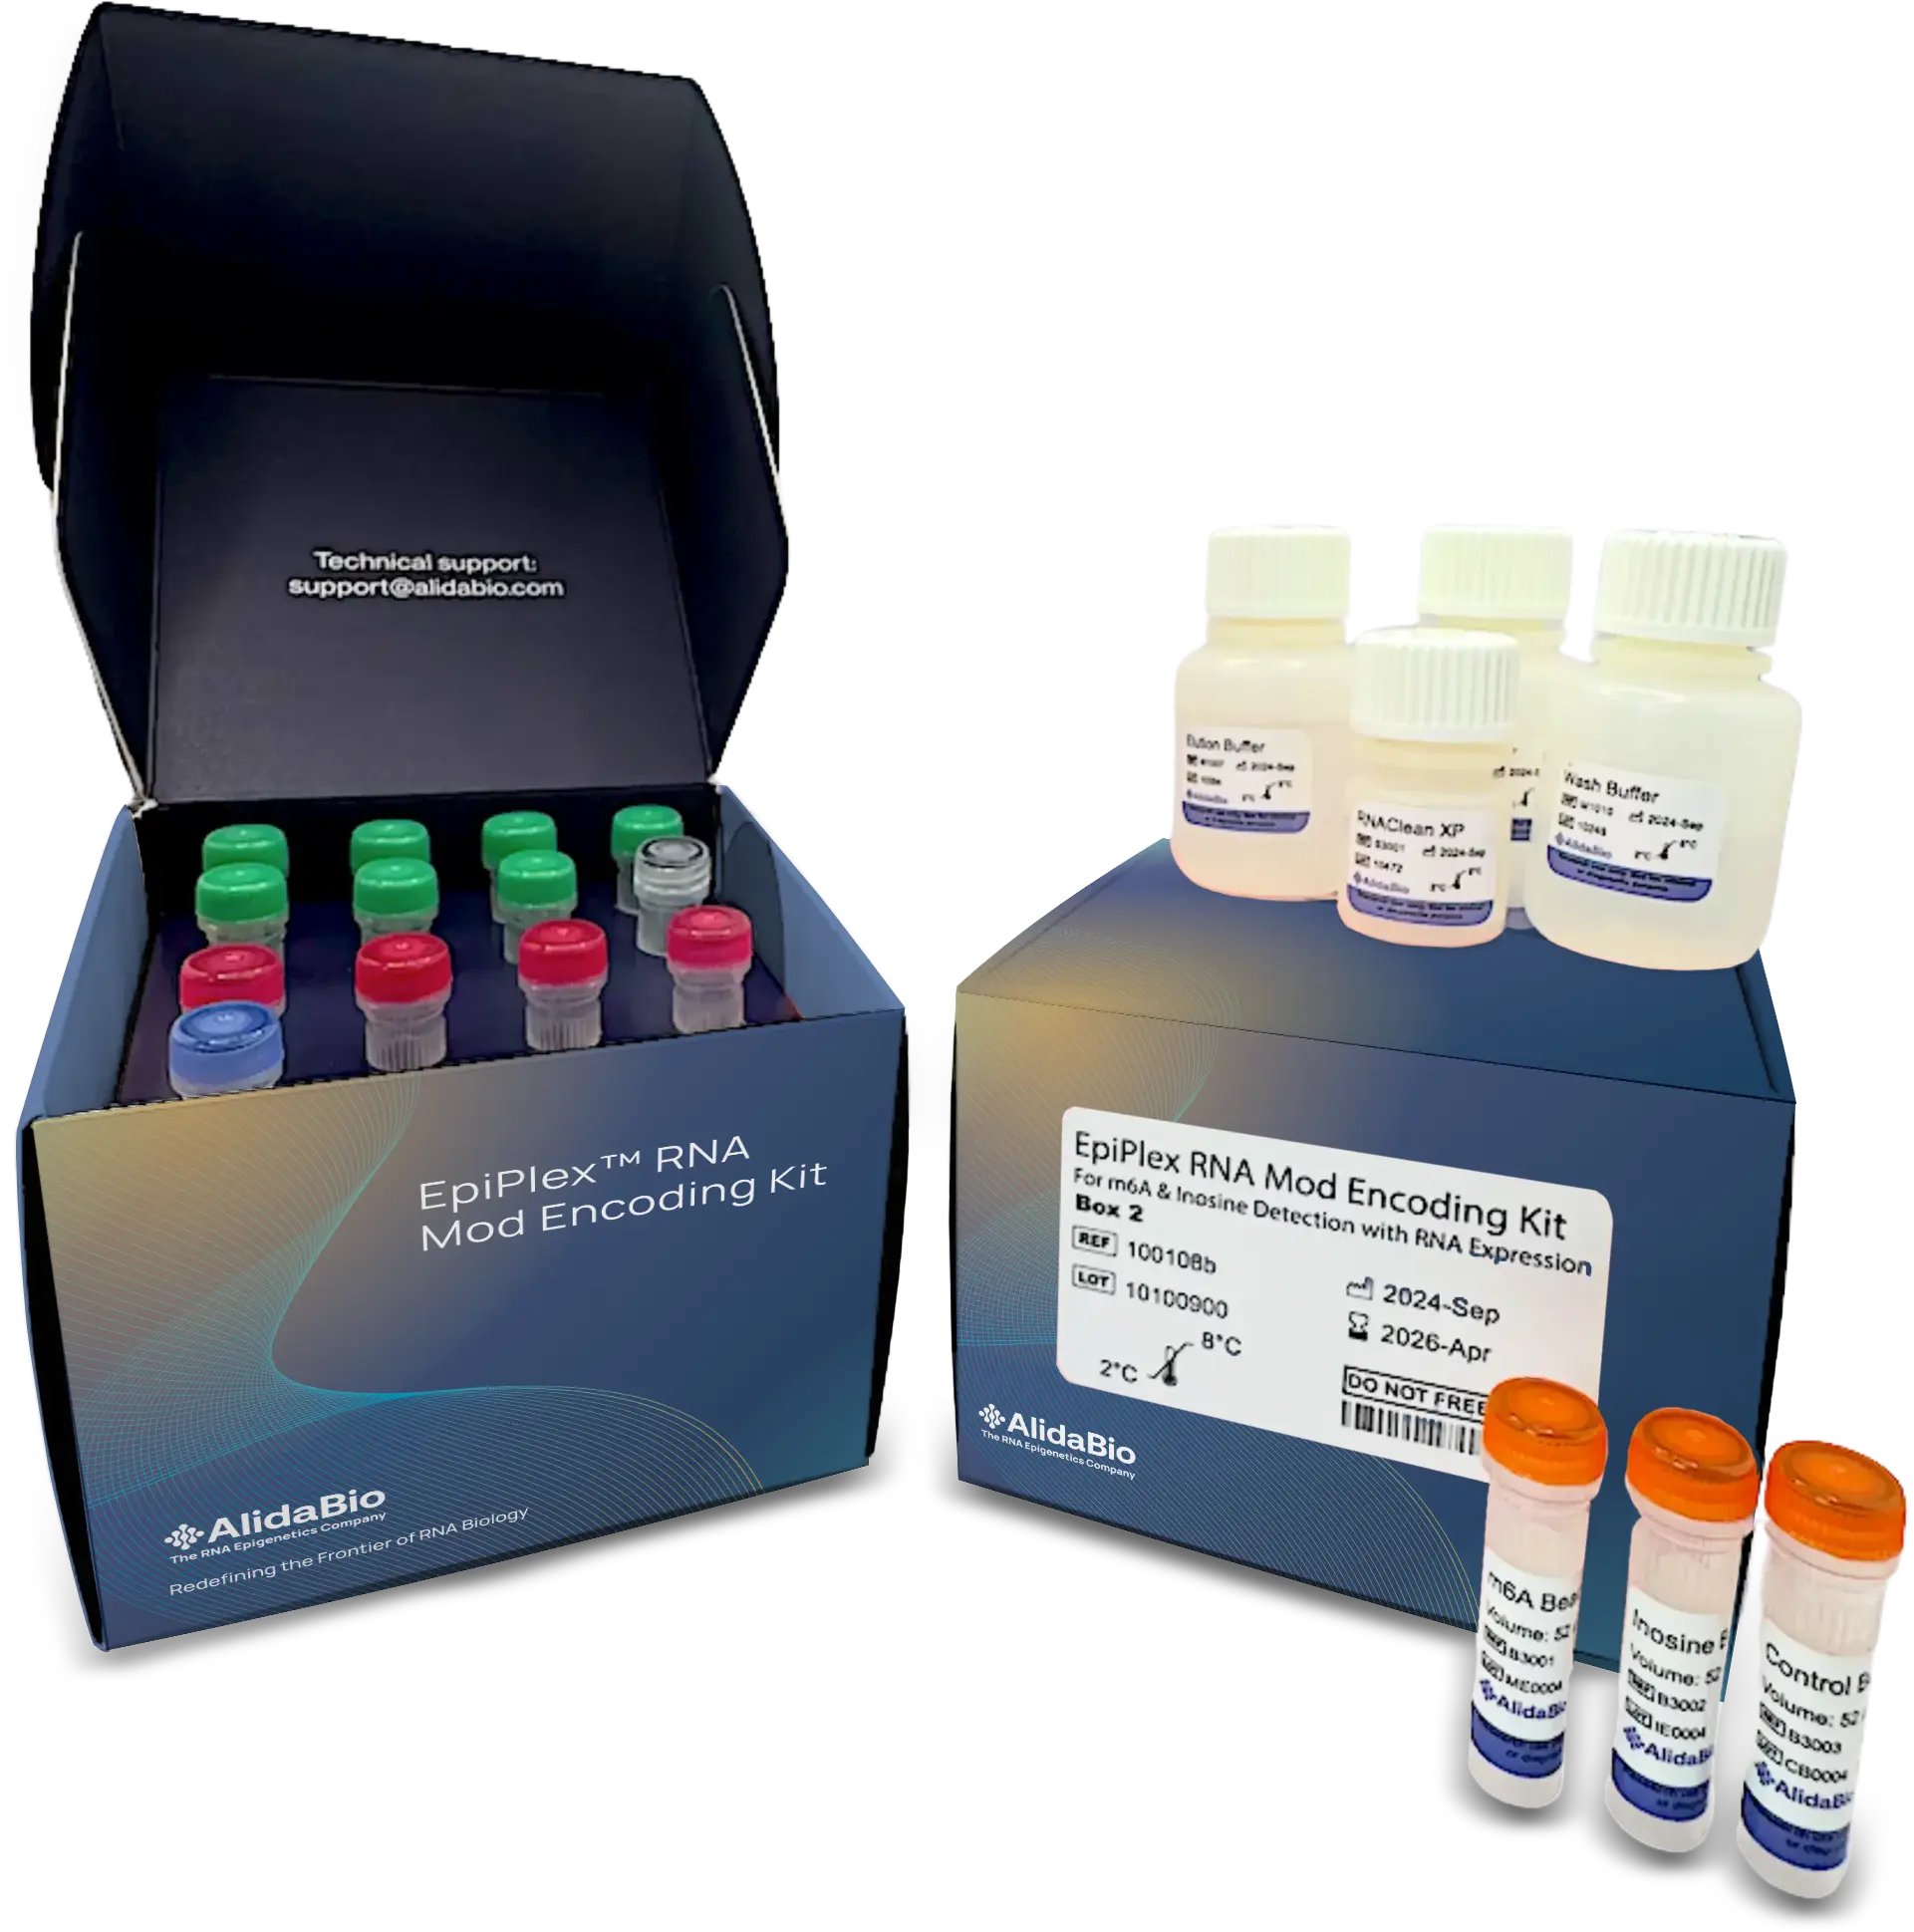
EpiPlex™ RNA Mod Encoding Kit
Platform kit for m6A and inosine detection with RNA expression—highly reproducible, correlative data in a single reaction.

EpiScout™ Analysis Software
EpiScout is AlidaBio’s end to end analysis software that turns EpiPlex sequencing data into RNA modification maps and RNA expression insights through a streamlined, researcher friendly workflow.
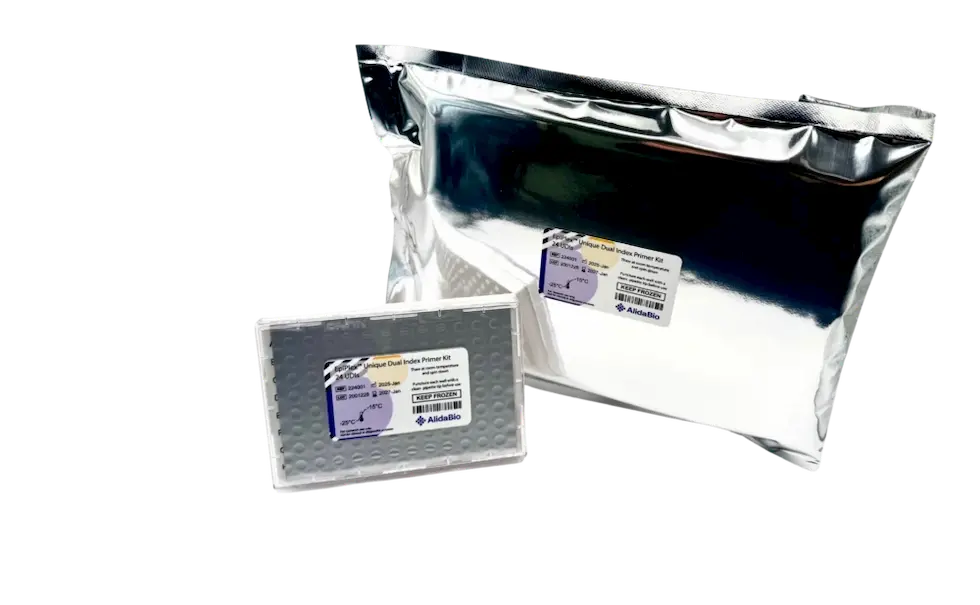
EpiPlex™ UDI Kit
Unique dual index primer kit for multiplexing and library identification.
EpiScout™ Software Makes Data Analysis Simple
Identifies transcript regions with RNA modifications and calculates their relative abundance. Provides quantitative sample comparisons through integrated spike-in controls.
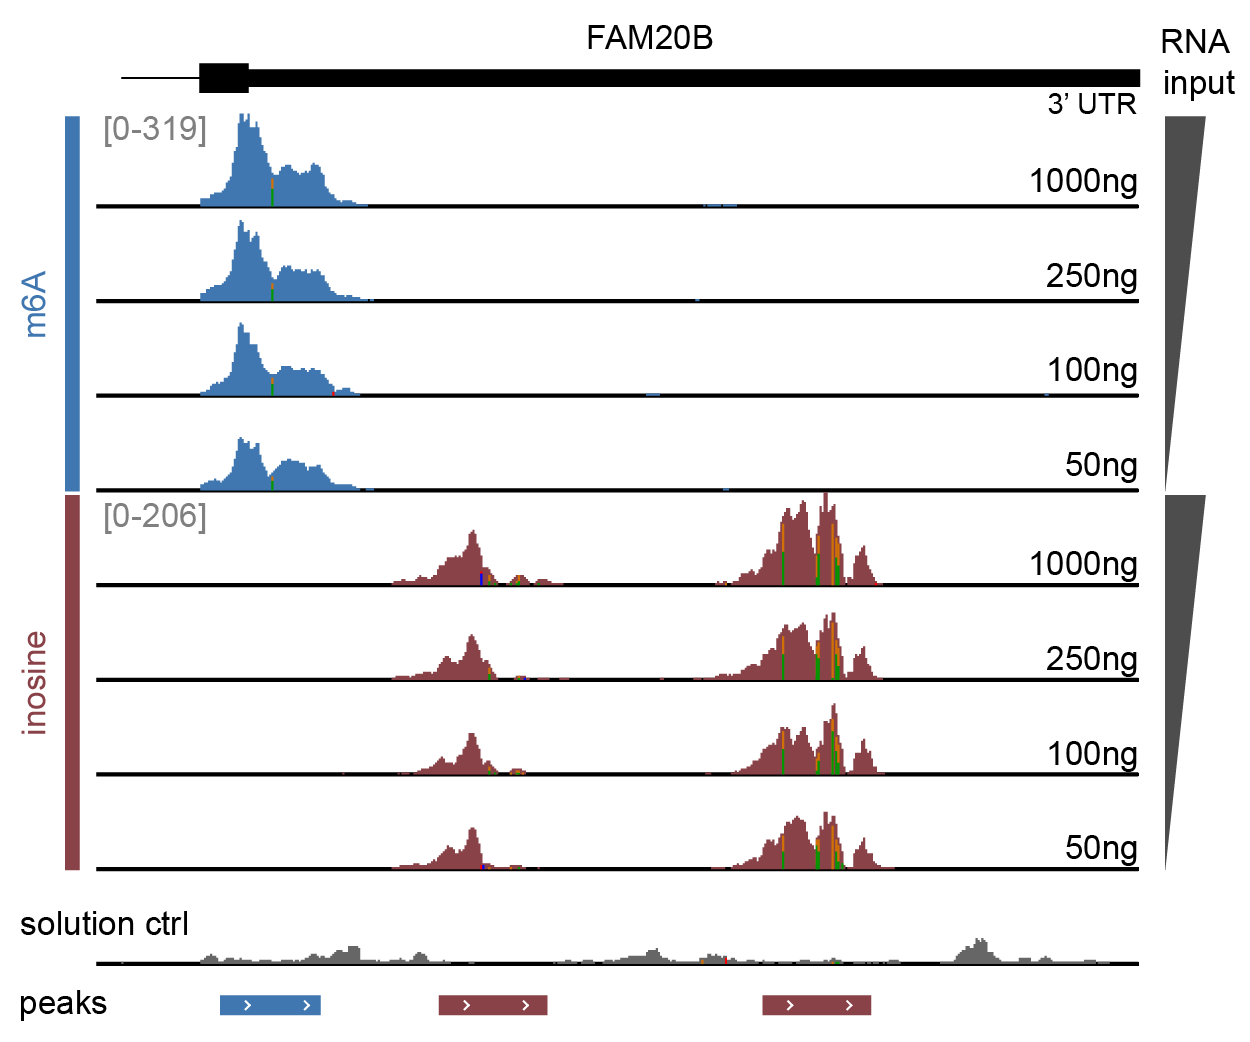
Genome browser view of the FAM20B gene 3′UTR
over a range of RNA inputs. Sequencing data were trimmed, aligned, deduplicated and split by modification barcode, with separate read tracks for m6A (blue), inosine (red) and the solution control (grey). Enrichment with EpiPlex binders generates peaks indicating the presence of RNA modifications. The bed file marks peak locations as identified by the EpiScout peak caller.
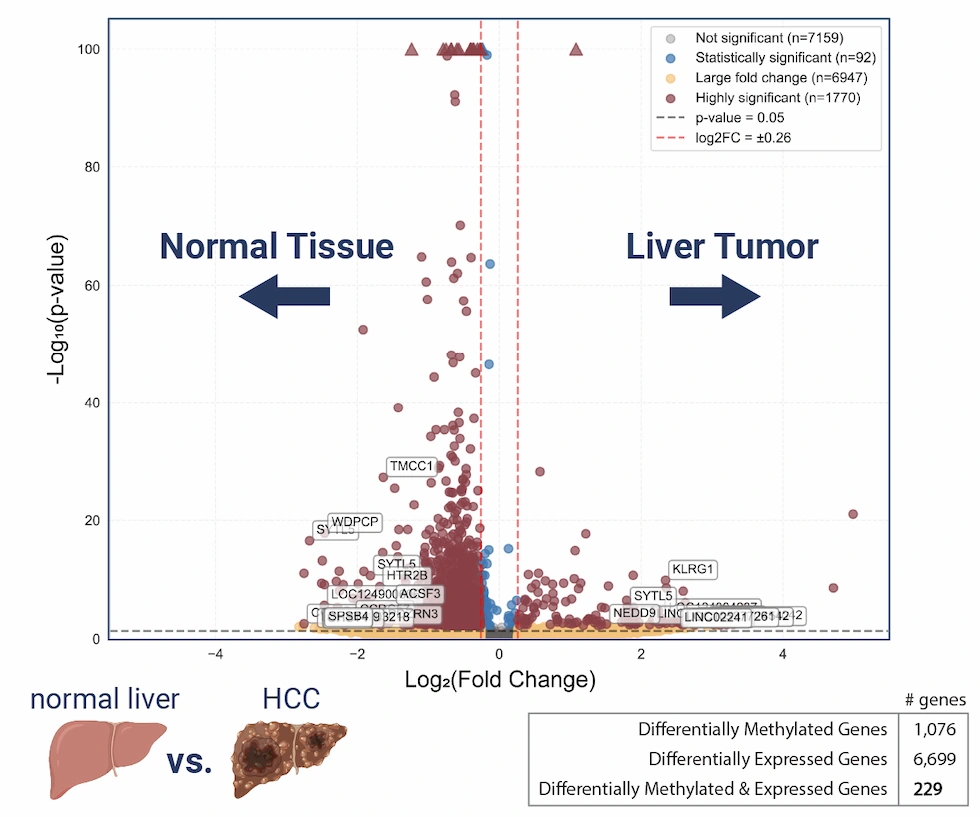
Differential analysis of adenosine methylation
across paired tumor/normal liver tissue RNA. Using a machine learning–trained peak caller and a quantification module that leverages integrated spike-in controls, EpiScout delivers high-confidence differential methylation information, visualized through volcano plots for intuitive sample-to-sample comparison.
Ready to get started?
Request a quote for EpiPlex™ Services or explore products and technology.