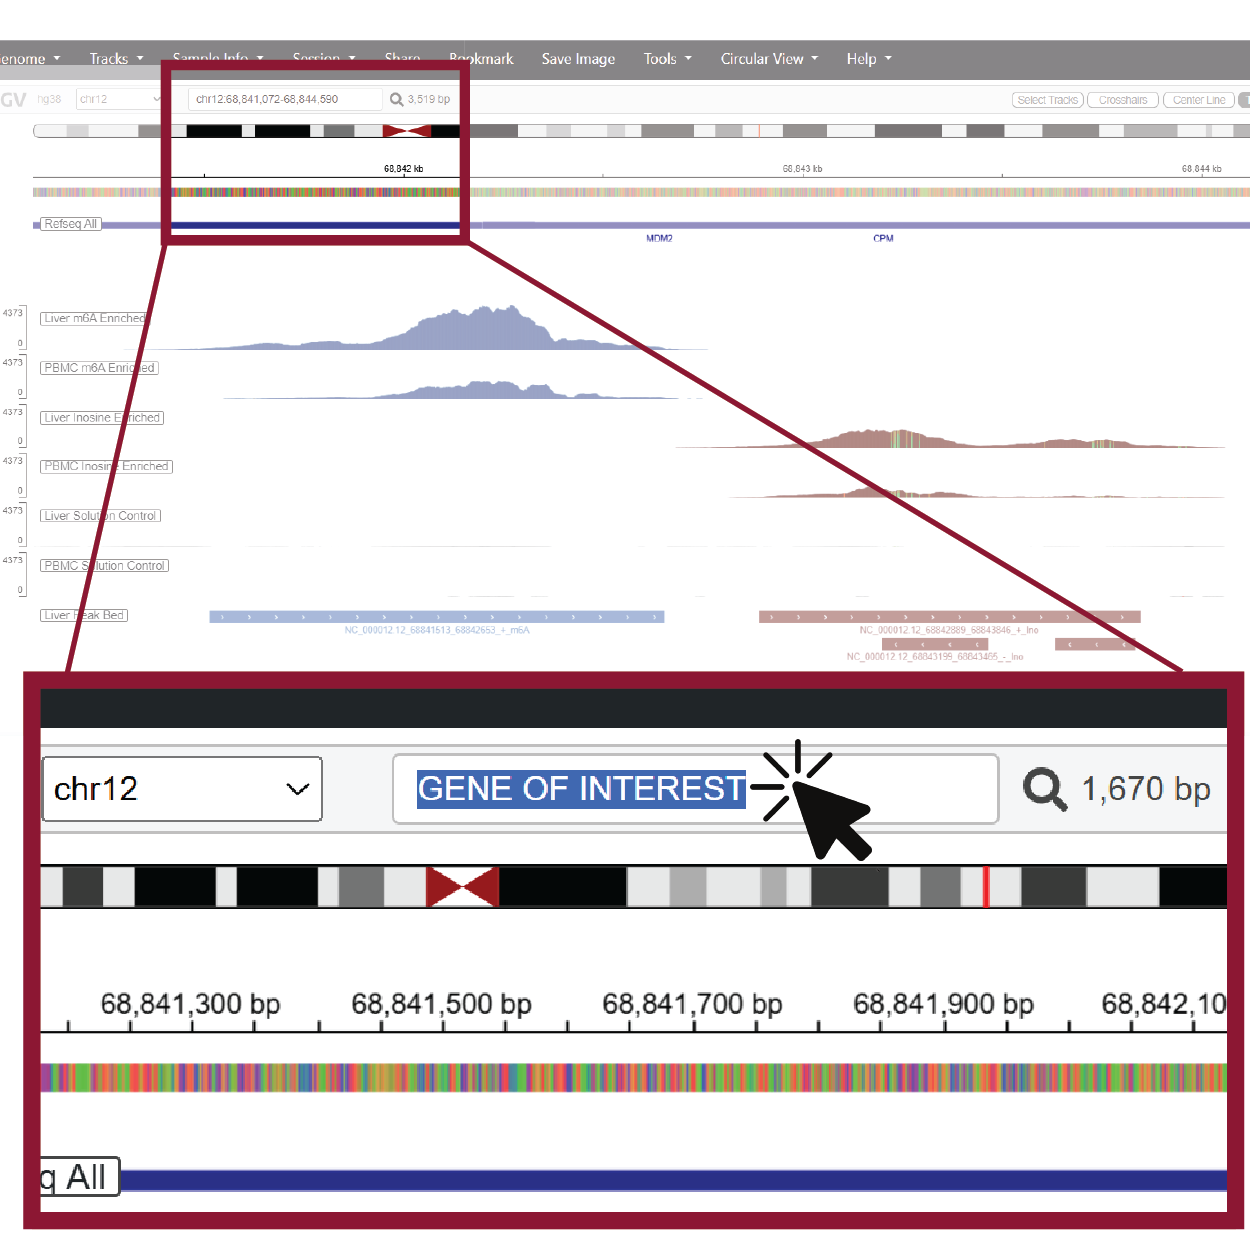
1. Use the search bar to navigate to other genes
The IGV search bar accepts gene names or genomic coordinates. Type a gene symbol or region into the box and press Enter, and the browser will jump directly to your region of interest.

Detect, visualize, and explore m6A, inosine, and RNA expression profiles generated with the EpiPlex™ Platform across key regions of the healthy human brain.
Use the interactive brain map below to open pre-configured IGV sessions and see region-specific epitranscriptomic patterns.
Hover over each region to see its label, and click to open a genome browser session with m6A, inosine, and RNA-seq tracks for that region.
The IGV search bar accepts gene names or genomic coordinates. Type a gene symbol or region into the box and press Enter, and the browser will jump directly to your region of interest.
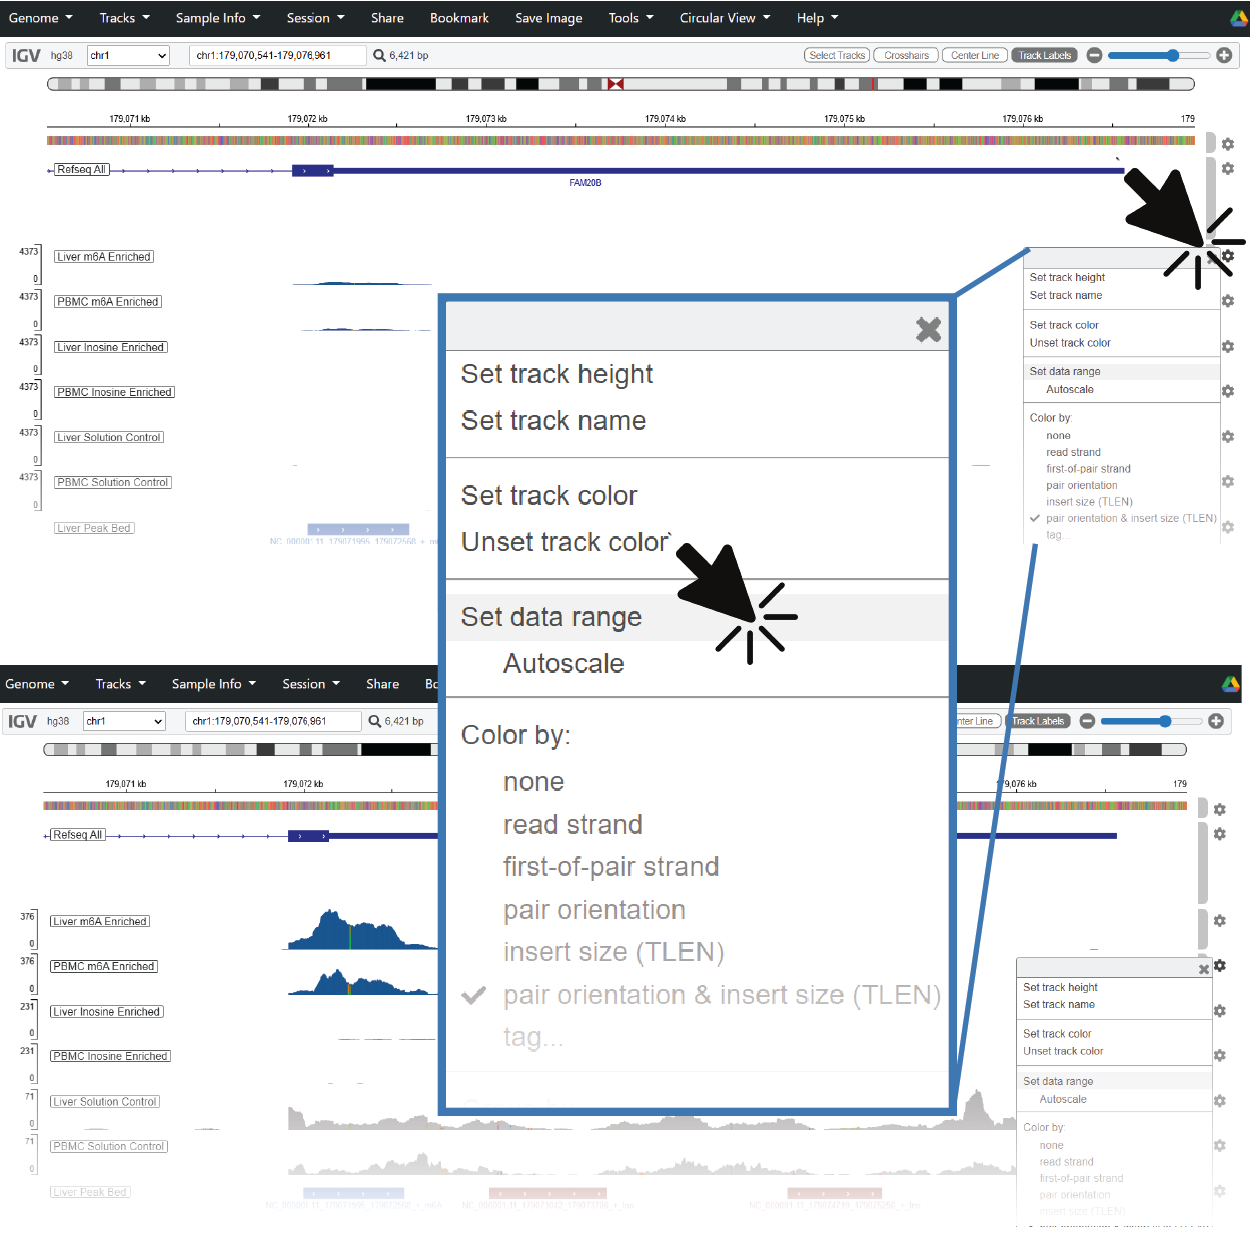
When you jump to a new region, coverage and modification tracks can span a wide dynamic range. If you don’t see clear pileups or peak shapes, try right-clicking on the track to adjust the data range or enable autoscaling.
This dataset profiles epitranscriptomic signatures in healthy human brain tissue and is designed as an interactive exploration tool.