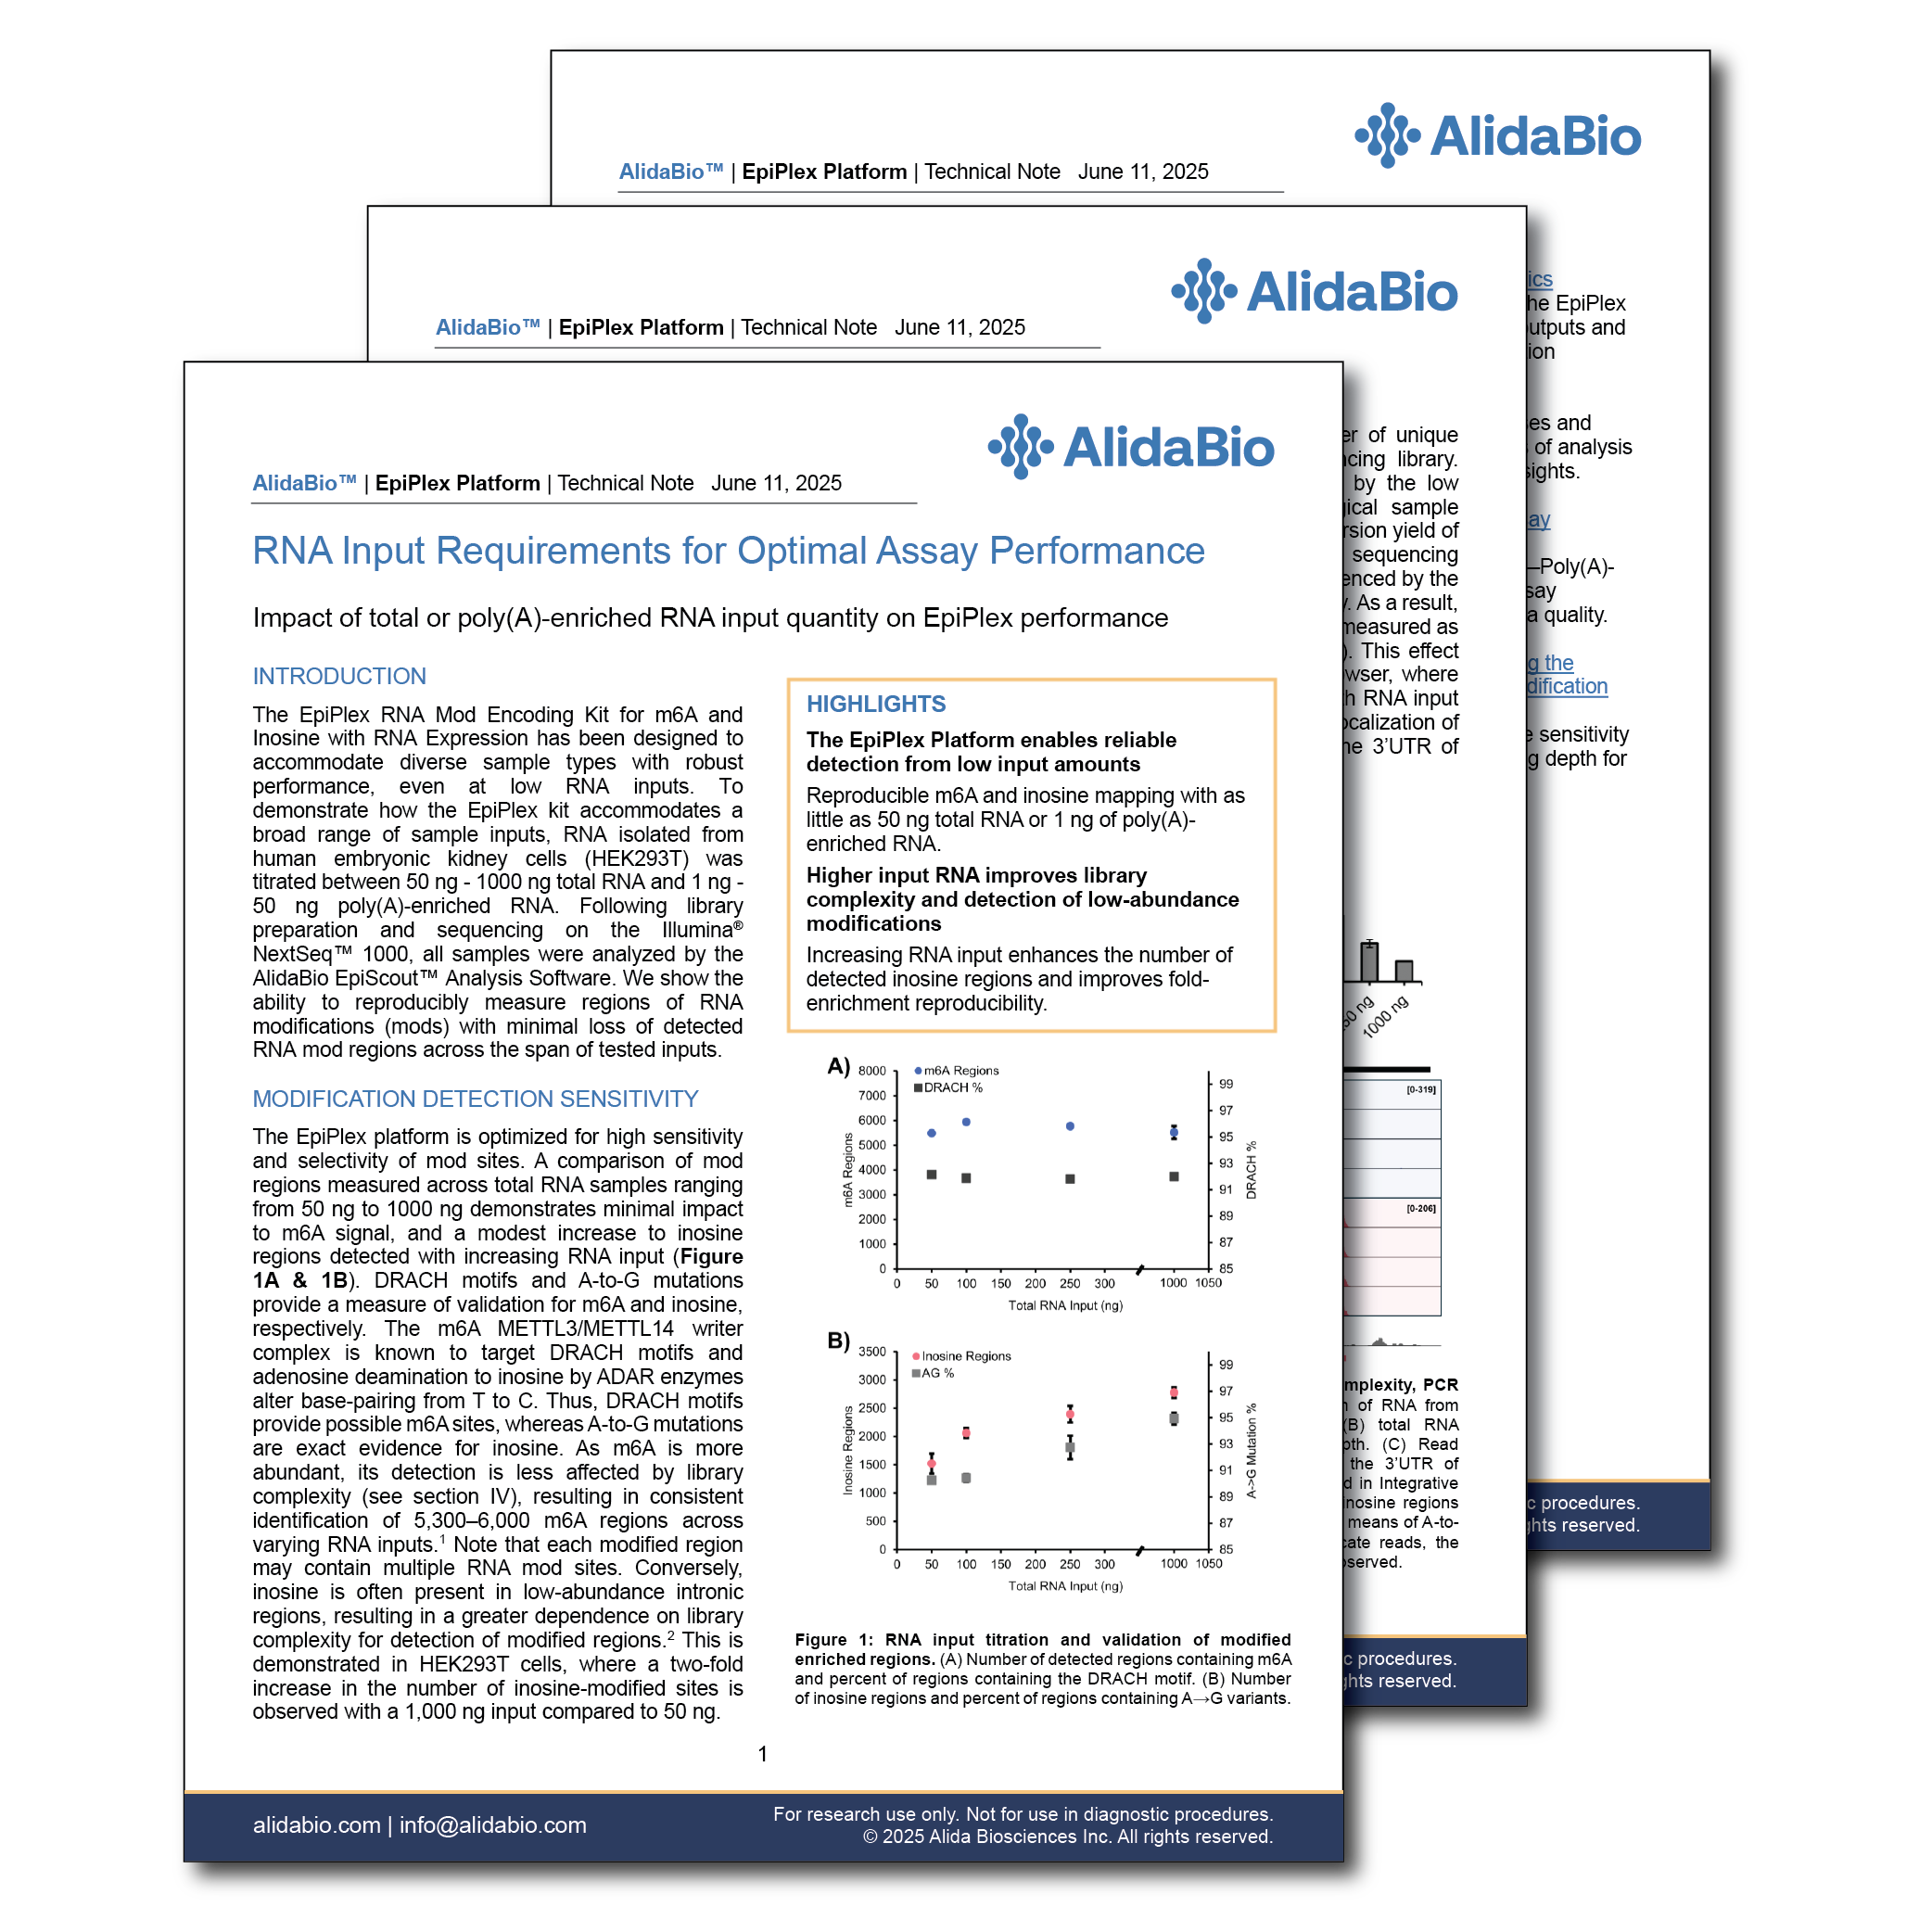
EpiPlex™ Platform for m6A & Inosine Detection with RNA Expression
Detect, locate, and quantify multiple RNA modifications plus RNA expression, in one simple experiment.
Product Information

EpiPlex™ Platform Kit for m6A & Inosine Detection with RNA Expression
for highly reproducible, correlative data in a single reaction

Multi-modification Analysis
Read m6A and Inosine in one reaction.
Correlate changes between multiple modification types and find out which genes are up or downregulated in test and control conditions, and how the gene expression levels relate to RNA modification status. Identify equally expressed yet differentially modified genes to understand how the epitranscriptome modulates the proteome.

Relative Quantification
Compare relative RNA modification levels.
Only a subset of RNA transcripts of a given gene contains RNA modifications to fine-tune function. The EpiPlex assay includes spike-in controls as normalization standards to infer the modification stoichiometry of each gene. Normalizing the assay signals in this way also reduces assay variability and enables data comparisons across operators and experiment batches.

Low RNA Input
High performance with a broad RNA input range
Tissue biopsies often contain less than 500 ng of total RNA, challenging many RNA sequencing methods. With the EpiPlex assay you can achieve exceptional data quality with as little as 20 ng poly(A)-selected RNA or 250 ng total RNA—and even lower inputs have been tested successfully. Our user guides provide protocols for total, poly(A) and FFPE RNA to accommodate your research interests.

Streamlined Workflow
A simple 1-day library prep
Process up to 24 samples in parallel in a 7 hour library prep workflow with minimal hands-on time. Magnetic beads capture your precious RNA, minimizing losses during reaction steps. The format is ideal for multi-channel pipetting in strip tubes or plates.

Scalable Throughput
An automation friendly workflow
Scale beyond 24 samples by transferring the protocol to a liquid handler and process large sample cohorts. EpiPlex libraries can be multiplexed with other libraries on common short read sequencers. Kick off batch sample analysis and comparisons with a few mouse clicks using the EpiScout Cloud App hosted by DNAnexus.

Study Disease Biology
Study what truly interests you
Due to workflow limitations and variability researchers sometimes chose to limit their research to immobilized cell lines that can be grown in large quantities in the lab. With EpiPlex you can count on experimental success and there is no reason to shy away from profiling rare, hard to obtain sample types.
Product Features: EpiPlex™ RNA Mod Encoding Kit for m6A & Inosine Detection with RNA Expression
EpiScout Analysis Software
RNA modification and RNA expression analysis for all scientists

Seamless Data Processing
Upload your sequencing data and receive a comprehensive results report in a hands-off workflow

Machine Learning-Trained Peak Calling
Get accurate results with a custom tailored peak calling algorithms

Cloud App
Available as user-friendly cloud app via DNAnexus
EpiScout™ Software Makes Data Analysis Simple
Identifies transcript regions with RNA modifications and calculates their relative abundance
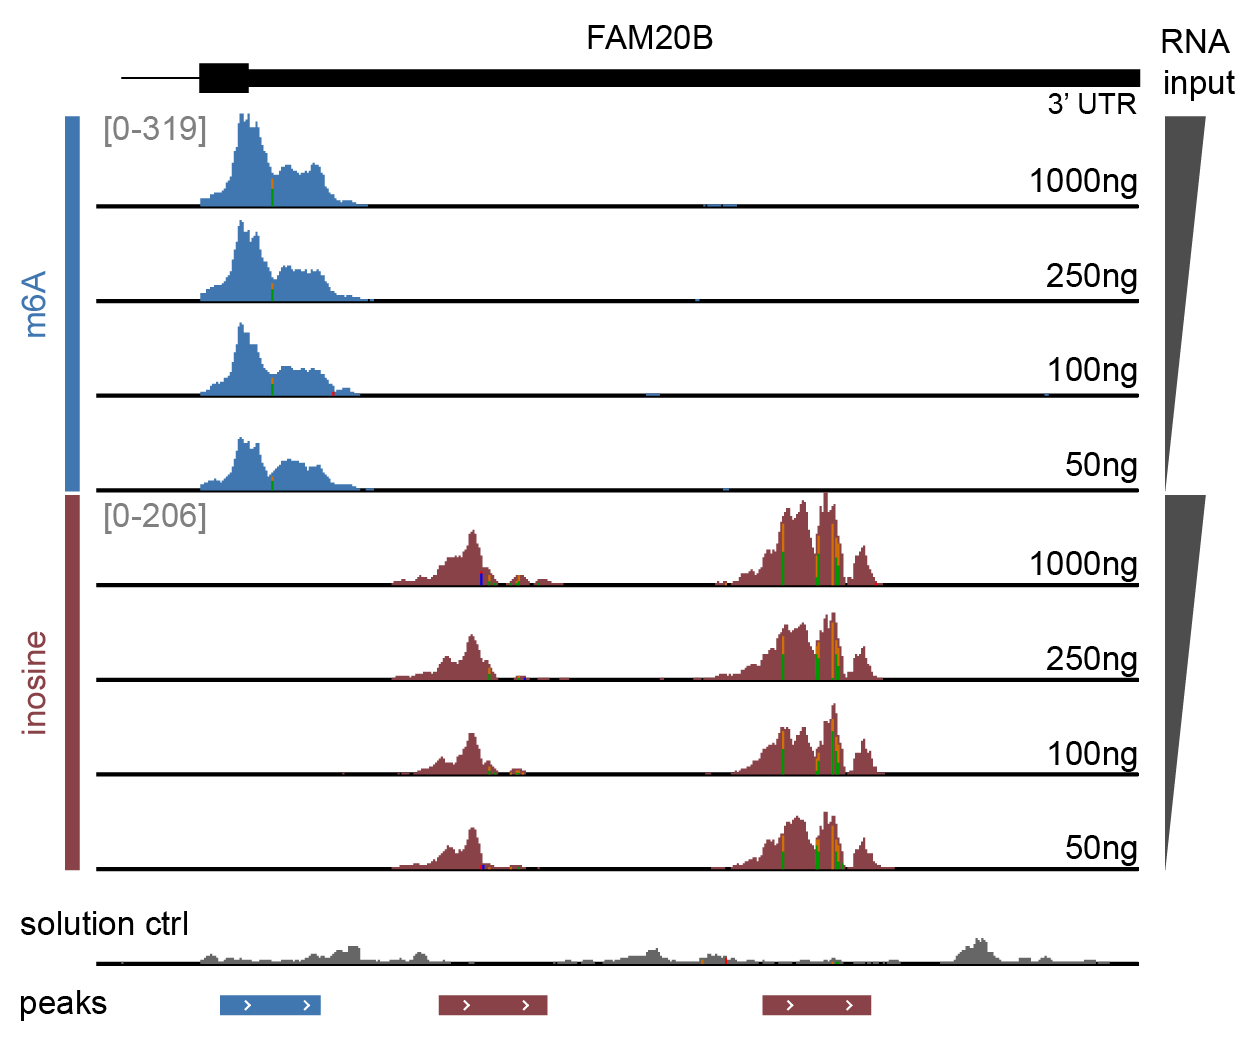
Genome browser view of the FAM20B gene 3’UTR over a range of RNA inputs
Sequencing data were trimmed, aligned, deduplicated and split by modification barcode, resulting in separate read tracks for m6A (blue), inosine (red) and the solution control (grey). Enrichment with EpiPlex binders generates peaks indicating the presence of RNA modifications. The y-axis corresponds to the number of sequencing reads, proportional to the modification abundance. The x-axis provides the location on the genome coordinate. Because inosine is read as a G in sequencing, its exact locations shows up as A-to-G mutation (vertical green line). The bed file at the bottom marks the peak locations, as identified by EpiScout peak caller.
Provides quantitative sample comparisons through integrated spike-in controls
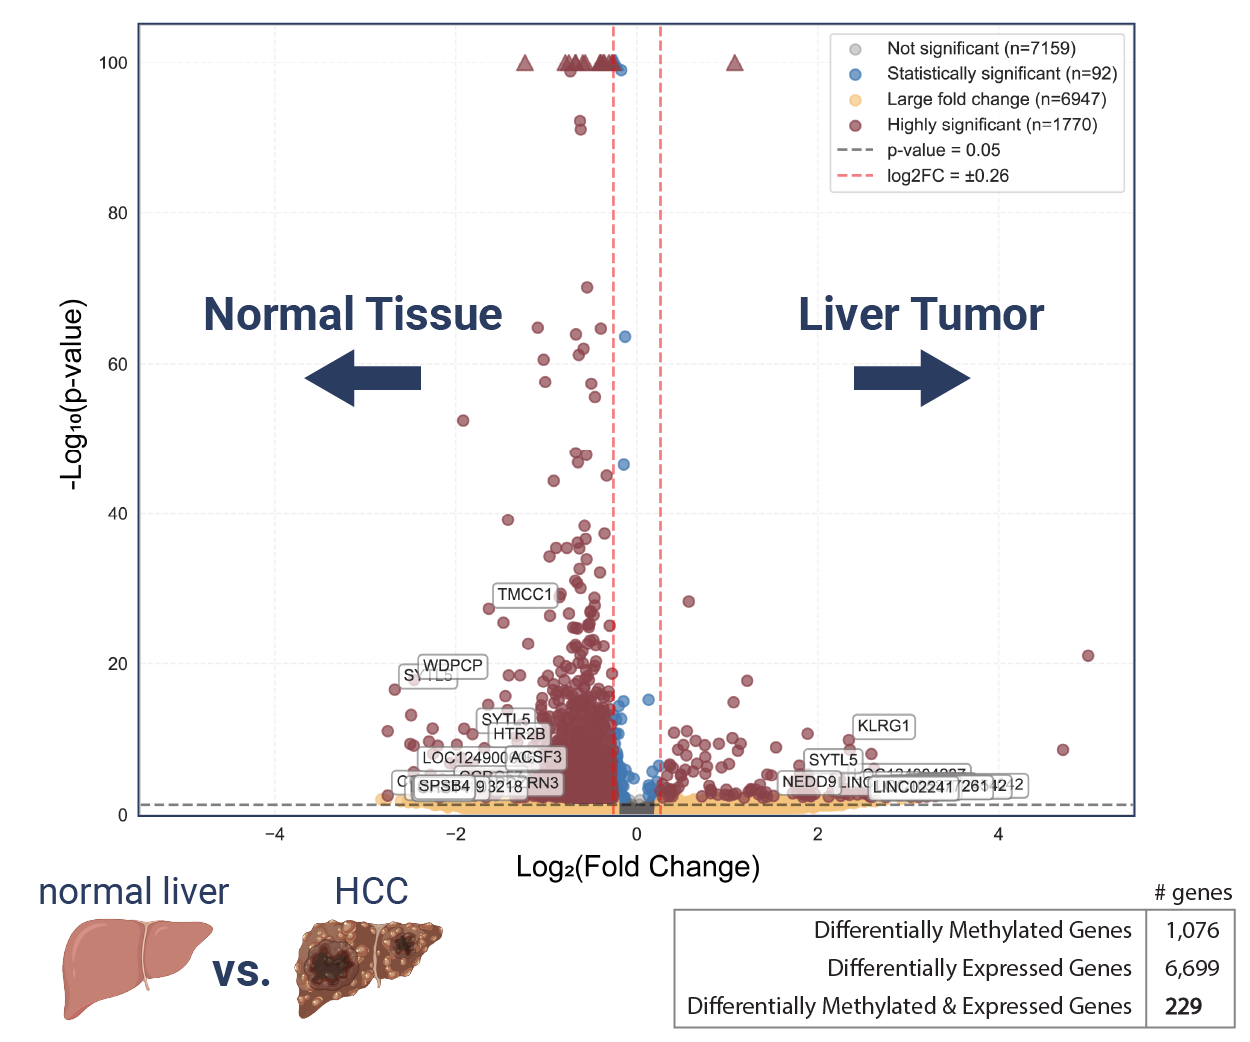
Differential analysis of adenosine methylation across paired tumor/normal liver tissue RNA
Using a machine learning trained peak caller and a quantification module that leverages the integrated spike-in controls, the EpiScout software delivers high-confidence differential methylation information, which is visualized through volcano plots for intuitive sample-to-sample comparison. Profiling RNA methylation in matched tumor–normal liver tissue from a hepatocellular carcinoma patient reveals a global hypomethylation signature, reflected by a leftward shift in the volcano plot. Despite this global trend, both hypo- and hyper-methylation occur at individual transcripts, highlighting the need to distinguish widespread effects from transcript-level differential methylation.